Overview
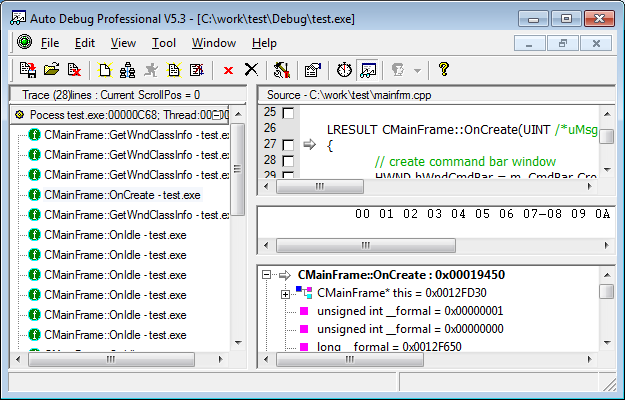
Auto Debug is a Windows API monitoring tool. It can be used to automatically trace calls to all functions exported by the shared libraries linked to a running process, including COM interfaces such as ActiveX. During tracing, all input and output parameter values are recorded, and memory dumps are generated to show the values referenced by the pointer-type arguments.
Unlike other call tracers, such as API Spy or API Monitor, Auto Debug does not require the user to develop any hooks or custom DLLs. It is very easy to use: just specify the command line-parameters to invoke a program (or attach Auto Debug to a program that is already running), select which API calls to monitor, and you will receive a detailed trace of all selected calls.
When available, the PDB files corresponding to the DLLs being traced are automatically analysed, resulting in more detailed and easier-to-navigate traces. Alternatively, in the absence of the original PDB files, the Professional version of Auto Debug can generate sufficiently detailed PDB files from the prototype headers often distributed with some libraries (for example, see the PDB file generated for comdlg32.dll at $InstallPathPDBsample).
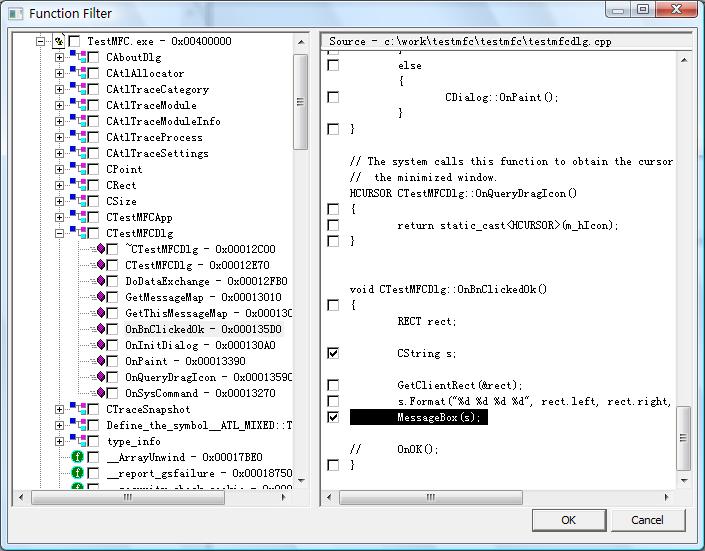
No source code is required to successfully trace the libraries or to interpret the trace results, but when it is available, the trace viewer will display the the exported functions visited by Auto Debug inside their source files.
Features
It doesn't need to rebuild the source code while monitoring inputting parameters and outputting results of the traced APIs in the target program automaticly, only monitoring the input and output of APIs.
- Export monitor result as txt format.
- Use VBScript or JScript to control Auto Debug.
- Source Code level monitor.
- Automatic analysis parameter type with PDB files.
- Very easy to generate PDB files without source code if you know the api prototype.
- Tracing your application with release version.
- The best API monitor tool.
- Tracing Release version with mapfile.
- Supporting Debug version and Release version, not need source code.
- Supporting tracing COM Interface.
- Supporting multithread.
- Not need to know the prototype of the functions.
- Not only trace for exported APIs, but also be effect for undocumented APIs.